So far, we have discussed what a HashTable is and some of its main features and characteristics. In the previous post, we showed and analyzed the Ruby implementations and highlight some the main design decisions made while developing the code for the DataStructures101 gem.
For the final installment of this HashTable series, we are going to measure the performance of the implementations using different parameters and then, analyze the main findings.
Why measure? Because it allows to decide with confidence which implementation is more suitable and efficient for a given context. Without the data, we are just guessing and being opinionated, at best.
Benchmark Code
To avoid reinventing the wheel, we are going to rely in two awesome tools to facilitate the process of measuring and presenting the results.
For benchmarking, we will use benchmark-ips gem, which provides iterations per second on top of the Benchmark module of the Ruby standard library. You can check its documentation for a more in-depth explanation.
Our Hash classes can receive lambda functions to change how the compression stage is done and for ProbeHashTable in particular, it also allows to modify the probing strategy used to solve collisions. For our performance comparisons we are going to depend on these advantages to produce our results.
To present these results, we are going to produce graph images using the Gruff gem.
Base Helper
We start with our base helper that accommodates the common codebase for all the performance comparison. For a possible reutilization for future objects implementations, we have left out any specific code targeting Hashes.
For our comparisons, we are fixing the ranges for the samples from 20,000 to 100,000 with fixed increases of 20,000. This is due to fact of alignment requirements from the Gruff gem to generate a graph. For the actual sample array, we guarantee that at least 25% percent of the elements are going to be repeated within the array creation to be able to test collision situations in the hashes.
class BenchmarkHelper
  attr_reader :reports

  def initialize(time: 5, warmup: 2)
    @time = time
    @warmup = warmup
    @reports = Hash.new { |hash, key| hash[key] = [] }
  end

  def self.range_labels
    range.each_with_object({})
         .with_index do |(val, hash), idx|
           hash[idx] = commafy(val)
         end
  end

  def self.range
    [20_000, 40_000, 60_000, 80_000, 100_000]
  end

  def self.commafy(num)
    num.to_s.chars.reverse
       .each_with_object(''.dup)
       .with_index do |(val, str), idx|
         str.prepend((idx % 3).zero? ? val + ',' : val)
       end.chop
  end

  def self.each_sample
    range.each do |n|
      top = 3 * n / 4
      yield Array.new(n) { rand(1...top) }
    end
  end

  protected

  def graph_title
    File.basename(@file, '.rb').split('_')
        .map(&:capitalize).join(' ')
  end

  def graph_name
    File.basename(@file, '.rb')
  end

  def output_file(suffix_name)
    path = File.join(File.expand_path('../..', __dir__), 'docs', 'graphs', 'hash')

    FileUtils.mkdir_p path

    File.join path, "#{graph_name}_#{suffix_name}.png"
  end

  def do_report
    Benchmark.ips do |bench|
      bench.config(time: @time, warmup: @warmup)

      yield bench

      bench.compare!
    end
  end
end
Benchmark and graph functions
Within the module, we provide the actual benchmark and graph generation methods to be included within each of the test cases. For all the different tests, we are interested in measure the three essential functions of our Hash classes: insert, find and delete.
For each method, we are going to measure their performance against randomized sample data to find out the average number of iterations per second under different loads. Sounds fancy?? I agree. But it is actually rather simple to do it. We are just using the ips method from the benchmark-ips to do the hard work for us.
Once you run the tests, the benchmark-ips gem displays the output to the console in a nice formatted way. But to facilitate the performance comparison we use the Gruff gem to generate Bar charts with the results generated from the benchmark tests.
module HashMethods
  def benchmark_methods
    self.class.each_sample do |sample|
      report = do_report do |bench|
        bench.report('ChainedHashTable#insert') do
          sample.each { |i| @chained_hash[i] = i }
        end

        bench.report('ProbeHashTable#insert') do
          sample.each { |i| @probe_hash[i] = i }
        end
      end
      reports[:insert] << report

      report = do_report do |bench|
        bench.report('ChainedHashTable#find') do
          sample.each { |i| @chained_hash[i] }
        end

        bench.report('ProbeHashTable#find') do
          sample.each { |i| @probe_hash[i] }
        end
      end
      reports[:find] << report

      report = do_report do |bench|
        bench.report('ChainedHashTable#delete') do
          sample.each { |i| @chained_hash.delete(i) }
        end

        bench.report('ProbeHashTable#delete') do
          sample.each { |i| @probe_hash.delete(i) }
        end
      end
      reports[:delete] << report
    end
  end

  def graph
    reports.each do |name, rep_entries|
      g = Gruff::Bar.new
      g.title = "#{name.capitalize} method for #{graph_title}"
      g.labels = self.class.range_labels
      g.x_axis_label = 'Number of Elements'
      g.y_axis_label = 'Iterations per second'
      g.y_axis_increment = 5
      g.minimum_value = 0
      # Avoids getting a Float vs nil comparision error
      g.maximum_value = 10
      g.show_labels_for_bar_values = true

      klass = 'ChainedHashTable'
      entries = rep_entries.map(&:entries).flatten

      mean_values = entries.select { |e| e.label.start_with?(klass) }.
          map { |e| e.stats.central_tendency }
      g.data(klass, mean_values)

      klass = 'ProbeHashTable'
      mean_values = entries.select { |e| e.label.start_with?(klass) }.
          map { |e| e.stats.central_tendency }
      g.data(klass, mean_values)

      g.write(output_file(name))
    end
  end
end
Default Benchmark
This test measures the performance for the Hashes using the default parameters, which are:
- Initial capacity: 31
- Prime value: 109_345_121
- Compression method: MAD method
- Probing method: Linear method (applies only to
ProbeHashTableclass)
class DefaultBenchmark < BenchmarkHelper
  include HashMethods

  def initialize
    super
    @file ||= __FILE__
    @chained_hash = DataStructures101::ChainedHashTable.new
    @probe_hash = DataStructures101::ProbeHashTable.new
  end
end
Division Method Benchmark
For this test, we replace the compression function for the hashes objects. Instead of the default MAD method, we use the simpler Division method strategy.
class DivisionMethodBenchmark < BenchmarkHelper
  include HashMethods

  def initialize
    super
    @file ||= __FILE__
    compression_lambda = ->(key, cap) { return key.hash % cap }
    @chained_hash = DataStructures101::ChainedHashTable.new(
      compression_lambda: compression_lambda
    )
    @probe_hash = DataStructures101::ProbeHashTable.new(
      compression_lambda: compression_lambda
    )
  end
end
Quadratic Probing Benchmark
This tests only affects the ProbeHashTable classes. Instead of performing a linear probing strategy, it switches to quadratic probing.
class QuadraticProbingBenchmark < BenchmarkHelper
  include HashMethods

  def initialize
    super
    @file ||= __FILE__
    @chained_hash = DataStructures101::ChainedHashTable.new
    @probe_hash = DataStructures101::ProbeHashTable.new(
      probe_lambda: ->(h, i, cap) { return (h + i**2) % cap }
    )
  end
end
Rake Tasks for Performance
Since our performance tests are not rspec-based, they cannot be run through the rspec cli. As an alternative, we can create a set of rake task to run our tests. We generate the file shown (named perf.rake) below within a tasks folder in our gem folder.
Dir.glob("#{File.dirname(__FILE__)}/../spec/perf/hash/*.rb") { |r| load r}

namespace :perf do
  namespace :hash do

    desc 'Benchmarks default hashes objects'
    task :default_hash do
      bench = DefaultBenchmark.new
      bench.benchmark_methods
      bench.graph
    end

    desc 'Benchmarks hashes using division method for compression'
    task :division_method do
      bench = DivisionMethodBenchmark.new
      bench.benchmark_methods
      bench.graph
    end

    desc 'Benchmarks hashes using quadratic probe for ProbeHash'
    task :quadratic_probing do
      bench = QuadraticProbingBenchmark.new
      bench.benchmark_methods
      bench.graph
    end
  end

  desc 'Runs all hashes benchmarks'
  task :hash => ['hash:default_hash', 'hash:division_method', 'hash:quadratic_probing']
end
You can run the tasks individually tasks by calling rake perf:hash:'task_name' or simply, run them all by calling rake perf:hash.
Now, what remains is to load the perf.rake file on the gem Rakefile adding the following line: Dir.glob('tasks/*.rake').each { |r| load r}
Analysis
After having run the rake task to compare the implementations, we have these nice graphs to show. We are only going to analyze three of the results, one method per each test type; but feel free to check the rest at https://github.com/renehernandez/data_structures_101/tree/master/docs/graphs/hash and play with the benchmark helper to try different things.
For each of the tests, we are showing the number of iterations per second recorded for a given randomized sample of numbers. Clearly, as the sample size grows, the iterations per second is going to decrease for both Hash implementations. What we are really trying to find is how the ratio between the results changes accross different samples.
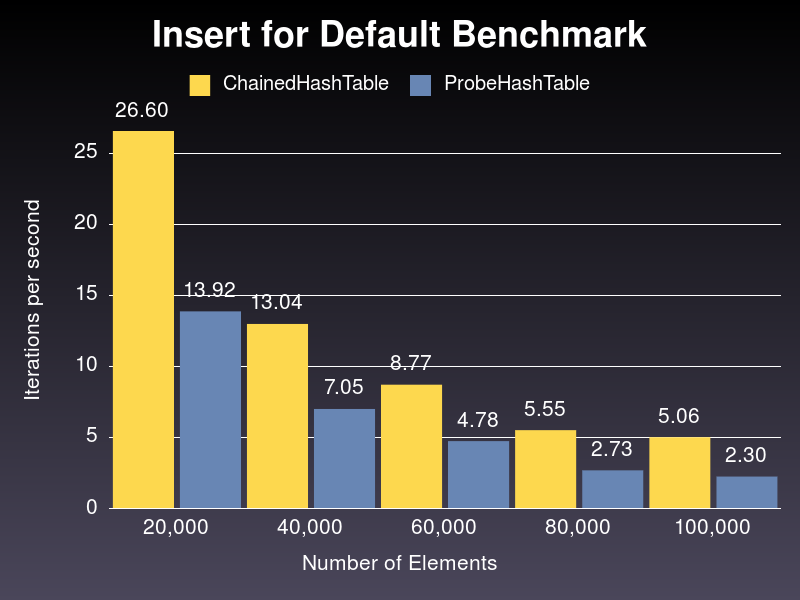
As we can see from the graph above, ChainedHashTable has better performance using default parameters. And performance gap grows larger as well, from around 1.91 times better for 20,000 random numbers to 2.2 times better for 100,000 random numbers.
Now, let’s check what happens when we use the Division strategy for compression:
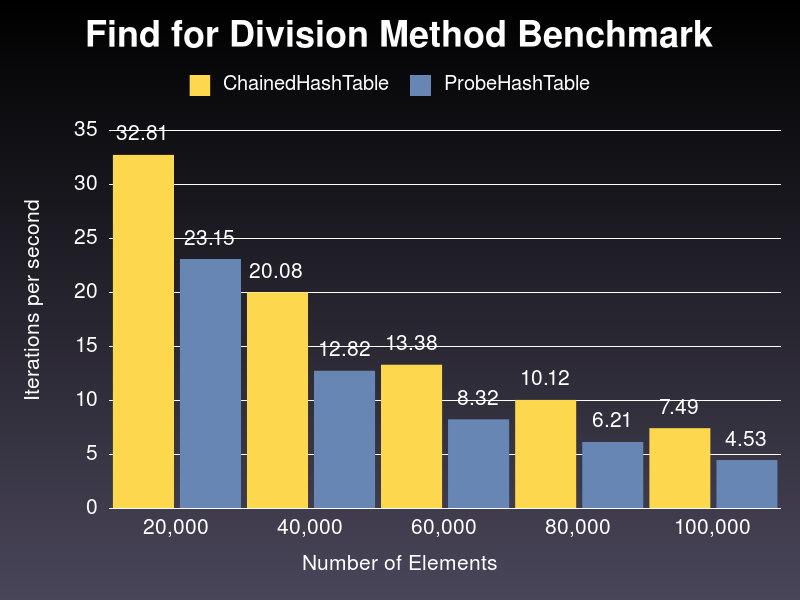
Again, we can see how better the performance for ChainedHashTable implementation is against the ProbeHashTable class and the gap trend manifests as well, although smaller, from around 1.41 times better when sampling 20,000 numbers to 1.65 times better when sampling 100,000.
Finally, the graph below shows the performance for the delete method on both implementations, ChainedHashTable using default parameters while ProbeHashTable gets changed to use quadratic probing for collission handling:
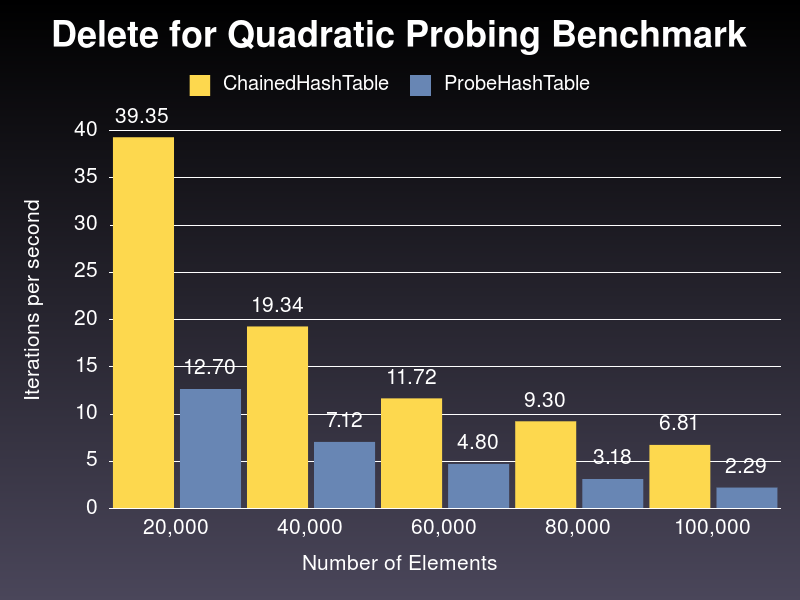
In this scenerario, the results are further apart. ChainedHashTable performs from 2.5 times to 3 times better that its counterpart in the samples.
To sum it up, it seems to be that ChainedHashTable is more performant from a time point of view, but don’t forget that memory analysis should also be considered when deciding for any option in any real scenario. If you managed to provide a memory profile, let me know in the comments!!
Conclusions
With this post, we are concluding the Hash series for the DataStructures101 gem. Getting this 3-part posts done was a journey on its own, but I am glad I did it. It gave me the chance to increase my toolbox with two great additions: Benchmark-ips and Gruff gems and to explore several ideas while modeling my final solution.
I just want to give a big kudos as well to this post and its author Daniel P. Clark. It helped me to understand how to approach my own performance implementation.
Hey!! A final word. Thank you for reading this. I am hoping you like it as much as I do. See you soon and stay tuned for more!!